

Delivering real-time insights and smart analytics for faster, clearer decisions from above.
Seer Satellite Solutions empowers organizations with accessible, actionable data—transforming satellite imagery into real-time strategic intelligence for smarter decision-making on the ground.
THE TECHNOLOGY
Turning Data Into Decisions
Field Crop Monitoring transforms raw satellite and field data into practical insights you can act on. With powerful analytics and global expertise, we help you farm smarter—cutting costs, reducing risks, and unlocking better yields, all from one platform.
Complete Farm Insights
Turn data into decisions. With Seer, you get clear insights on your fields — from weather and crop history to vegetation health — so you can act faster, reduce risks, and grow smarter.

Farming With a Bird’s-Eye View
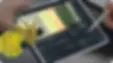
No need for constant field visits. With up-to-date satellite imagery, you can monitor plant health, growth stages, soil moisture, and vegetation changes in real time. Quickly detect problem areas and stay on top of crop conditions — all from your screen.
Real-Time Risk Detection
Get alerted to potential issues early—before they turn into big problems. Stay on top of vegetation health shifts and take action quickly to safeguard your yield.

Smart Resource Management
Make every input count. With Variable Rate Application (VRA) maps, you can apply fertilizers, water, seeds, and fuel precisely where they’re needed—cutting costs while boosting yields.

Tailored Reporting
Easily generate custom reports that organize field data into clear, easy-to-read tables. Share insights with your team and stakeholders instantly for faster, smarter decisions.

Simplify Farming In 6 Steps
Let’s walk you through it
Farming doesn’t need to be complicated. With Seer Field Crop Monitoring, you get clear insights and easy-to-use tools that guide you from monitoring crops to making smarter decisions. In just six steps, we turn complex satellite data into practical actions that save time, cut costs, and boost yields.

Step 1 - Add Your Fields
Upload a file with land plot boundaries or draw them. Add info about current and previous seasons.
Step 2 - Access Satellite Data
Get the latest satellite images right when they capture your field. Use NDVI and other vegetation indices to see how your crops are doing and fix issues fast.


Step 3 - Analyze Trends
Dive into historical data on vegetation and weather. Spot patterns and use them to make smarter decisions next time.
Step 4 - Check Current Risks
Use all our tools to detect any risks to your plants during the growing season. Stay ahead of problems before they happen.


Step 5 - Take Action
Send scouts to the land plot or plan your field activities based on your monitoring and analysis. Track the outcomes and see the results of your decisions.
Step 6 - Share Data
Prepare a custom report for the current field state and share it with stakeholders.

Seer lets you manage unlimited fields, log activities, and upload machinery data with ease. Our AI assistant delivers smart field overviews, actionable recommendations, crop rotation insights, and custom reports to keep you ahead.
Access satellite data from 9 sources via API, with daily readings at 3×3m resolution. Work with vegetation and moisture indices (NDVI, NDRE, RECI, MSAVI, NDMI), generate vegetation and soil sampling maps, and track seasonal analytics.
Use weather data dating back to 2008, get 14-day forecasts, and receive alerts for cold or heat stress. Spot risks with global view maps, integrate Davis stations, and rely on dedicated support for smooth operations.
SIPI (Structure Insensitive Pigment Index)
Pigment balance (carotenoids vs chlorophyll); flags stress/sunburn/ripening.
NDVI (Normalized Difference Vegetation Index)
Measures crop vigor and overall plant health.
NDVI (Normalized Difference Vegetation Index)
Measures crop vigor and overall plant health.
MSAVI (Modified Soil-Adjusted Vegetation Index)
Reduces soil background noise; works well in early growth and cloudy conditions.
GNDVI (Green NDVI)
Focuses on chlorophyll activity, useful for nitrogen management.
NDRE (Normalized Difference Red Edge)
Detecting chlorophyll content deep in the canopy (not just the top leaves.
RECI (Red Edge Chlorophyll Index)
Tracks chlorophyll and helps guide fertilizer decisions.
NDVI (Normalized Difference Vegetation Index)
Measures crop vigor and overall plant health.
PSRI (Plant Senescence Reflectance Index)
A spectral index used to monitor plant health and detect senescence, or aging, in plants.
GCI (Green Chlorophyll Index)
Final-stage chlorophyll status before harvest
NDMI (Normalized Difference Moisture Index)
used to assess the water content within vegetation

Solutions That Fit — and Drive Results
Seer partners with leading experts to deliver satellite-driven solutions built by experienced GIS specialists and data engineers. Using advanced neural networks, we provide highly accurate data that helps you reduce costs, save time, and gain a competitive edge.


Field boundaries detection
Neural networks on Sentinel-2 imagery automatically detect field contours and cultivated areas—saving time, cutting costs, and providing ready-to-use contour masks in .shp or .geotiff formats.

Crop classification
The Crop Classification Map lets you inventory regional crops each season, distinguish arable from non-arable land, and estimate hectarage by crop type.

Yield prediction
Yield prediction supports sustainable crop planning, better decisions, and trend analysis, with downloadable results in .xlsx, .csv, or .shp formats.

Harvest monitoring
Monitor harvest to ensure production chain traceability, improve decision-making, and minimize risks.

Soil organic carbon modeling & mapping
Get modeling and mapping of soil organic carbon to make crop management more sustainable and generate carbon credits.

Soil organic carbon forecasting
Forecast soil organic carbon dynamics to save up to 90% of soil sampling costs and profit from carbon credits.

Advanced soil moisture analytics
Make timely decisions about sudden changes in water levels on your fields using advanced soil moisture analytics.

Land cover classification
Monitor environmental pressures and improve land management with highly accurate land cover classification

Zoning API
Build vegetation and productivity maps for variable-rate application of inputs